15.5 million tickets, 2017 to 2024: what changed, why, and what the City should do next.
Toronto publishes every parking ticket it issues. I took eight years of them, 2017 to 2024, and went after three questions: what actually drove the changes in volume, where the recent revenue growth came from, and what the City should do next about enforcement, compliance and revenue. Then I built a forecast to see how much of it was predictable a year out.
The short version
In 2024 the total value of tickets Toronto issued rose $23.6M, or 19%, while the number of tickets fell 5%. Higher fines added $27.9M. Fewer tickets took away $4.3M.
The August 2024 fine increase looks like it changed behaviour. Offences that got the increase swung 39 points in year-over-year volume. Offences that didn't moved 3.
Enforcement is concentrated. The top 1% of locations got 38% of all 2024 tickets, and one address, 4700 Keele Street (York University), got 35,030 of them.
One definition matters for everything below. The dataset has the set fine for each ticket, not what anyone paid. "Value" here means tickets times set fine. The City reports collecting $149.7M in 2024, so the scale is close, but it isn't the same number.
Building one table I could trust
The raw data is 68 CSV files and they don't agree with each other. Some years come as three large files, some as monthly files, one year's files have no extension, and 2025 has quoted headers. Rather than write a parser per year, I loaded every file into DuckDB with all columns as text, then typed them in a second pass with try_cast, so a bad value becomes a null I can count instead of a crash.
Before building anything on top of it, I checked the table against a number I didn't produce. The City's Administrative Penalty System report for 2024 says 2,148,988 parking violation notices were issued. My 2024 count is 2,147,159. That's a 0.09% gap.
I didn't drop rows. About 0.1% of tickets have an impossible time, like minute 75. They stay in every total and come out only of the time-of-day analysis. I held out 2025 completely. It's the test set for the model and nothing else, so no finding on this page uses it.
Plate numbers are masked to their last five characters, so they aren't unique. That ruled out any analysis of repeat offenders and is why every recommendation below targets places, not drivers.
Volume measures enforcement, not parking
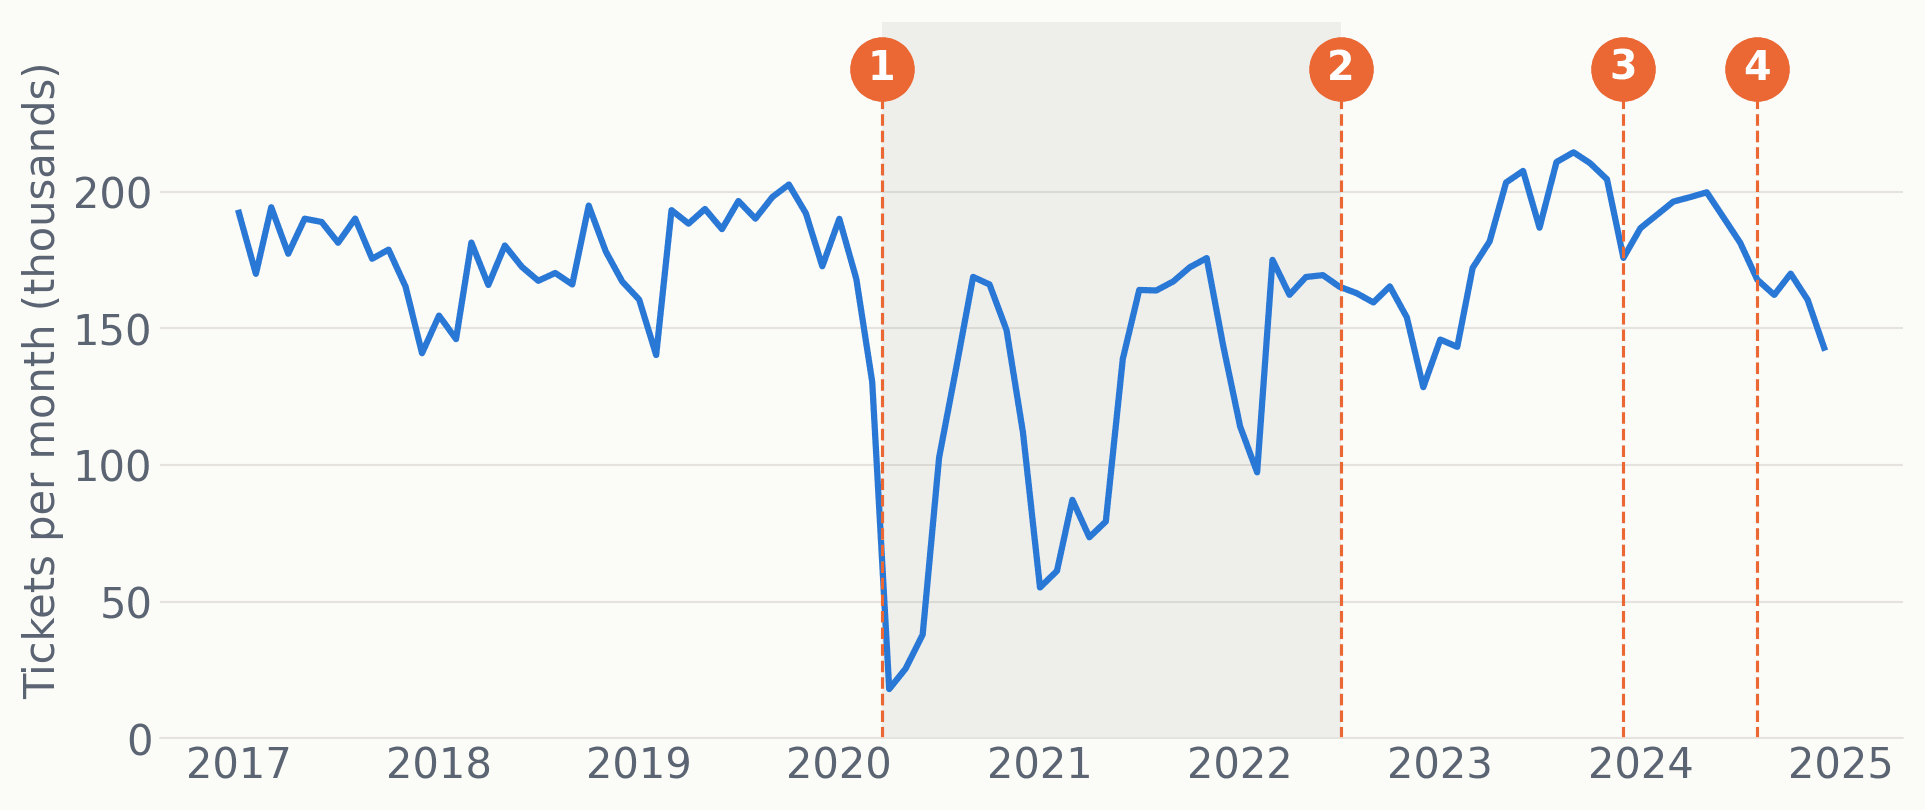
Monthly tickets, 2017 to 2024, with four policy markers
Before COVID the series is steady at roughly 170,000 to 200,000 tickets a month, with a dip every winter. Every major break after that lines up with a dated decision:
- March 18, 2020: police suspend enforcement of permit, time-limit and several other offences. April 2020 is down 90% from April 2019.
- July 4, 2022: rush-hour enforcement resumes. That one offence code goes from a few hundred tickets a month to about 8,000.
- December 1, 2023: fines for parking on private and municipal lots go from $30 to $75. You can see the exact day in the data.
- August 1, 2024: 123 fines go up. Volume drops from that point.
These are timing matches, not proof of cause. But four out of four lining up with enforcement decisions tells me ticket counts mostly track what the City chose to enforce, not how badly people parked. That changes how I read every other chart.
Where the 2024 money came from
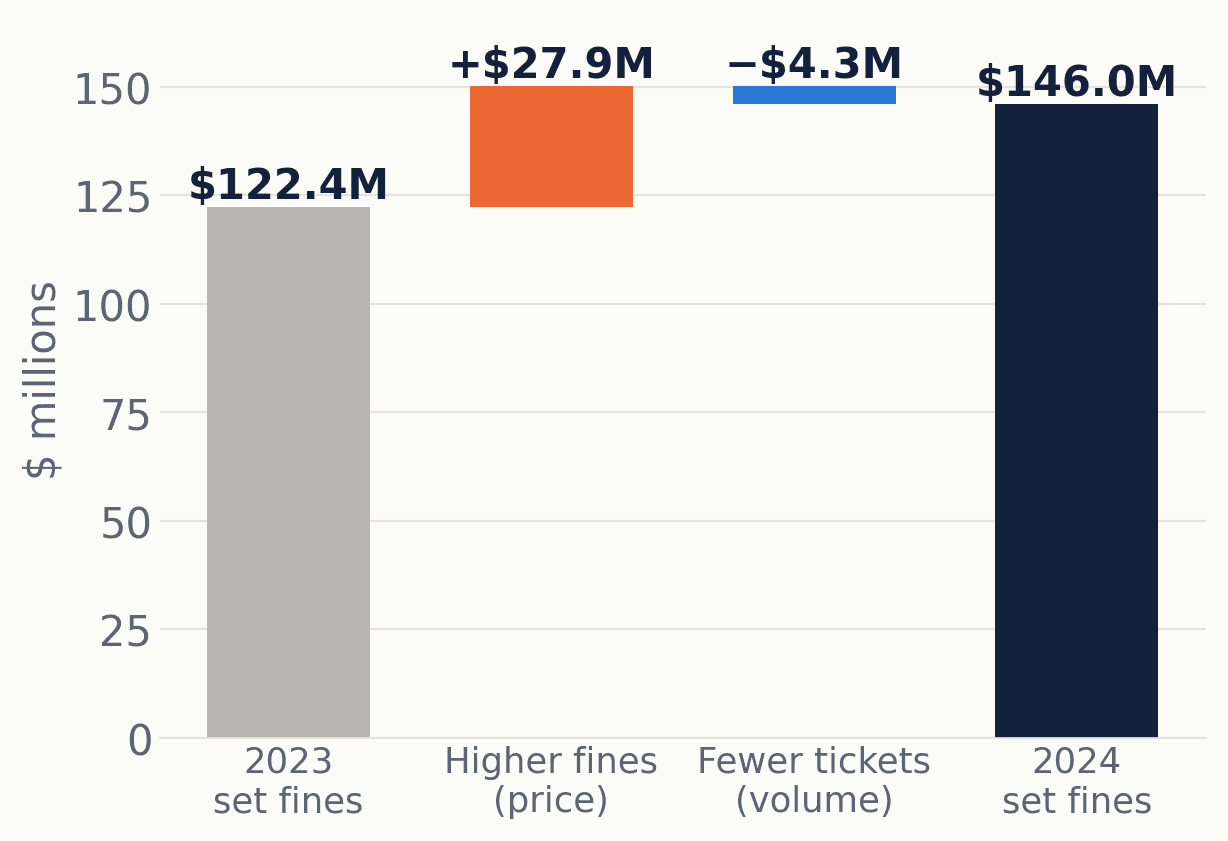
Price and volume bridge, 2023 to 2024
To split the $23.6M increase I worked offence code by code. The price effect is 2024 tickets times the change in average fine. The volume effect is the change in tickets times the 2023 average fine. Doing it per code matters: if the mix shifted toward expensive offences, a citywide average would report that as a price increase when it isn't one.
Price added $27.85M. Volume subtracted $4.20M. Codes that appeared or disappeared accounted for the last $0.08M. Against 2019 the picture is the same: 3% fewer tickets, 35% more value, and the average fine went from $49 to $68.
Did the fine increase change behaviour?
This was the question I cared most about, because "fines went up and tickets went down" has two readings. Drivers complied more, or the City wrote fewer tickets for unrelated reasons. The City's own 2024 report says it was short on officers, so the second reading is live.
A before-and-after on one group can't separate those. So I compared two groups over the same months.
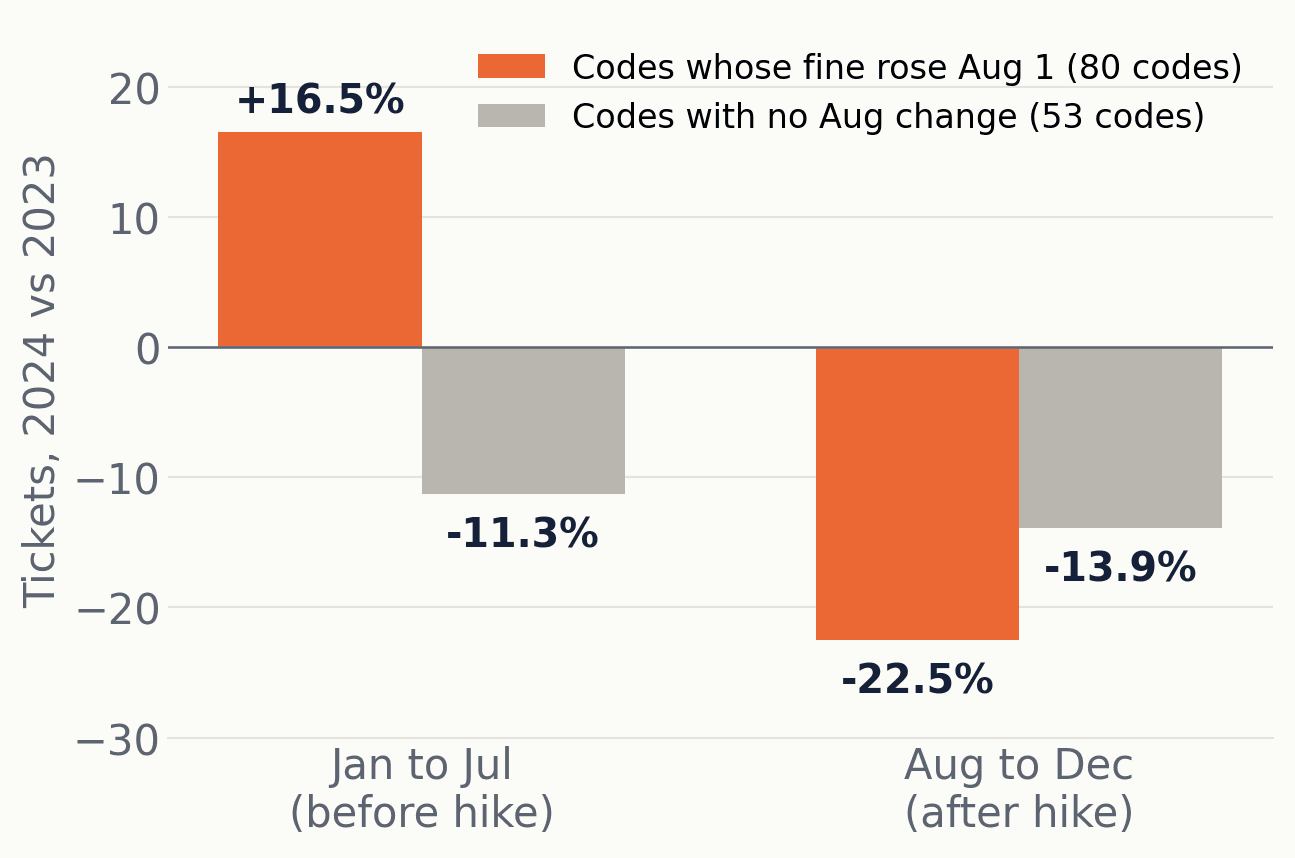
Fine-increase comparison, raised vs unchanged offences
The 80 offence codes whose fine rose on August 1 were running 16.5% above 2023 before the change and 22.5% below it after: a 39-point swing. The 53 codes with no change went from 11.3% below to 13.9% below. Both groups had the same officers, weather and traffic, so the roughly 36-point gap is my best estimate of what the fine did. Value on the raised offences still went up, from $40.4M to $42.3M for August to December.
The two groups weren't on the same trend before August, which is why I compared the change in each group rather than the levels. Two limits I can't remove with this data: officers might have shifted effort between offence types, and the data can't tell fewer violations apart from fewer tickets written.
Where and when
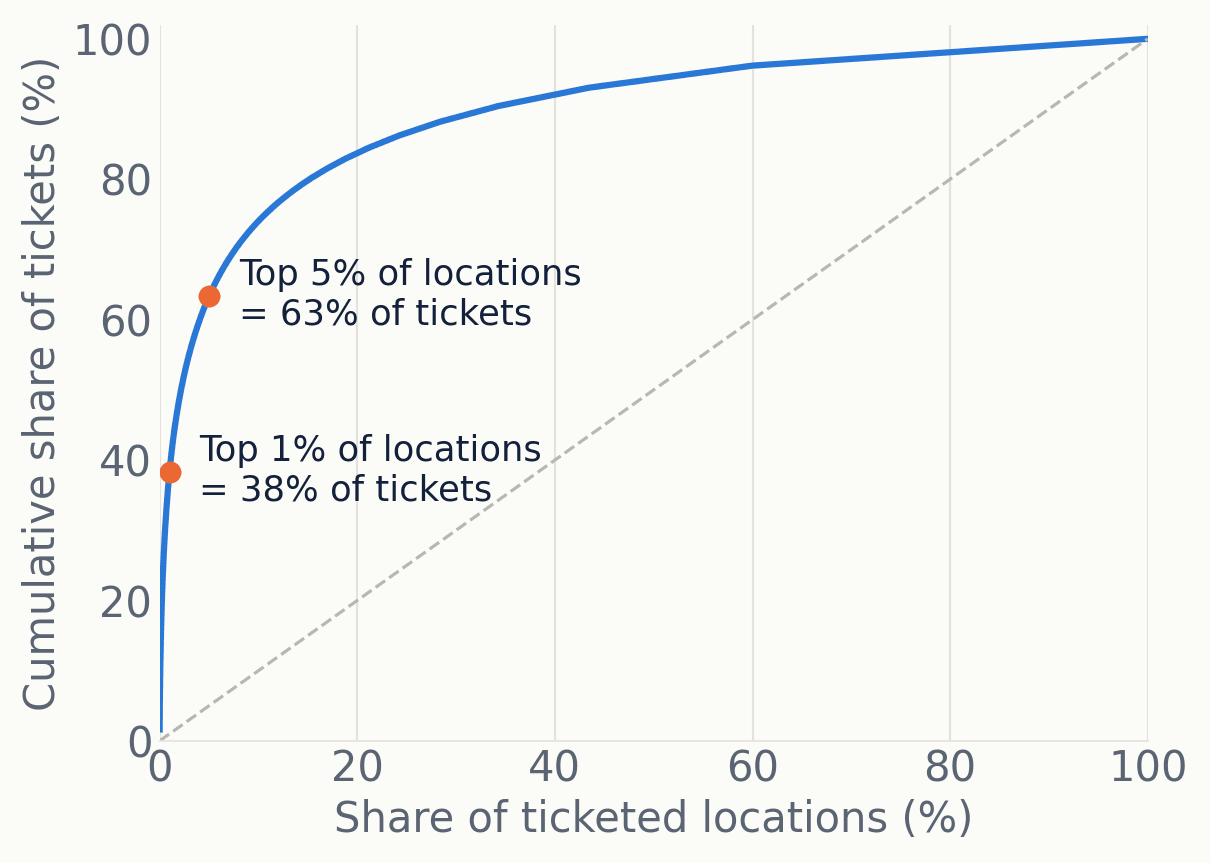
Share of 2024 tickets by location rank
The top 1% of locations got 38% of 2024 tickets and the top 5% got 63%. The 38% is a floor. Addresses aren't spelled consistently ("ST" and "STREET"), so some places are split across two entries. 4700 Keele Street alone had 35,030 tickets and $2.75M in set fines, 98.5% of them private-property offences. A location that gets ticketed that heavily every year is telling you tickets aren't fixing the problem there.
By time, 28% of tickets land on weekdays between 9:00 and 14:00, which is 15% of the week's hours. Another 21% fall between midnight and 5:00, almost all overnight permit parking. Weekends get 22% of tickets across 29% of the week. The pattern follows the officer schedule more than any obvious pattern in driving.
Out-of-province plates got 85,441 tickets worth $5.5M in 2024, up from 3.4% of tickets in 2019 to 4.0%. Quebec plates are 37% of them. CBC reported in 2015 that about 15% of these tickets get paid. That figure is old, and I couldn't find a newer one.
Forecasting 2025
If ticket volume mostly follows enforcement decisions and the calendar, it should be predictable. I built a model that forecasts daily ticket counts and joined in one outside dataset, Ontario statutory holidays.
Every input is something the City knows a year ahead: day of week, time of year, holidays and the days next to them, a trend term, and flags for the COVID enforcement period and each fine regime. That restriction was deliberate. A model that needs next month's weather can't be used to set next year's budget.
I trained LightGBM on 2017 to 2024 and tested on 2025, which the model never saw. The baseline is what a lot of budgets do in practice: assume each day looks like the same weekday a year earlier.
| Tested on 2025 | Model | Same weekday last year |
|---|---|---|
| Daily error (MAPE) | 11.3% | 18.8% |
| Monthly error (MAPE) | 7.2% | 12.9% |
| Full-year total | 4.8% under | 4.4% over |
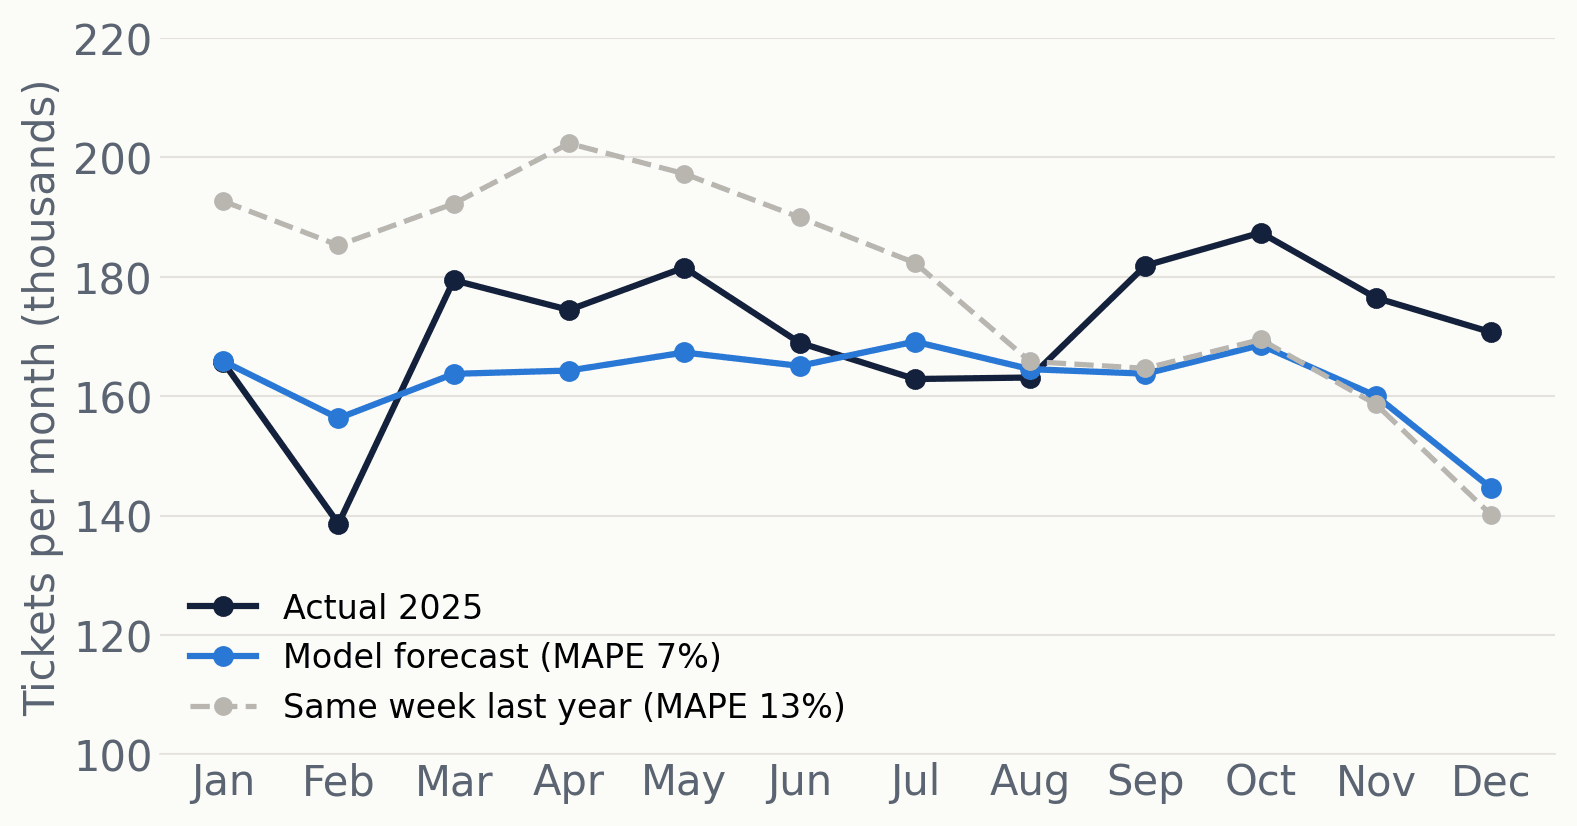
2025 forecast vs actual
The model wins clearly on daily and monthly error. On the full-year total the baseline was slightly closer, because its daily misses happened to cancel out. The baseline goes wrong in early 2025 because early 2024 was before the August fine increase, when volume was higher. The model knows the fine regime changed. Where the model misses is late 2025, when actual volume came in above forecast. My guess is officer staffing recovered, but staffing isn't in the data, so that stays a guess.
The holiday join earned its place: weekday holidays average 2,401 tickets against 6,472 on normal weekdays, 63% fewer.
What I recommended
| Move | Why | How to tell if it worked |
|---|---|---|
| Rebuild officer capacity | The City cites officer shortages. A rough average says each officer writes about 5,200 tickets a year, worth about $290K collected against about $148K in cost. | Officers at the 357 target; tickets per officer hour |
| Set fines for compliance, then test every change | The August 2024 increase cut volume on raised offences far more than on unchanged ones, and value still rose. | Rerun the two-group comparison after every fine change |
| Fix chronic hotspots | Top 1% of locations, 38% of tickets | Tickets at the top 100 locations, year over year |
| Pilot new shift coverage | 28% of tickets in 15% of the week's hours | Tickets per officer hour, pilot vs current windows |
| Collect from other provinces | $5.5M issued in 2024, Quebec 37% of it | Out-of-province payment rate; a plate-denial agreement with Quebec |
The officer number is an average across all officers. A new hire would add less than the average, and 357 is a target headcount, not the actual one. It still breaks even at half the yield.
What I'd do differently
Write the headline to match the evidence. My first draft said policy decisions "explain" every break in volume. What I showed is that they line up in time. The finding is the same, the claim is smaller, and the smaller claim is the one I can defend.
Don't call weekends under-ticketed. Weekends get 22% of tickets across 29% of the week, and my first draft called them under-ticketed. Weekend parking rules are looser, so fewer tickets could just mean fewer violations. I did frame the recommendation as a pilot that measures tickets per officer hour, which is the right test, but the draft had already reached the conclusion the pilot was supposed to check.
Report the annual forecast honestly the first time. My first draft said the model beat last year's pattern. It does on daily and monthly error. On the annual total it doesn't, and I should have said so up front instead of leaving it for someone to find.
Ask for two internal tables first. Payment status per ticket would turn set-fine value into actual revenue and replace a 2015 news figure on out-of-province collection. Officer deployment hours would turn every time and place chart into tickets per officer hour, which is the number that separates where the City enforces from where people break the rules.
Normalize addresses. A proper pass on street suffixes and abbreviations would tighten the concentration numbers, which right now understate it.
Code
load.py and clean.py build the table, analysis.sql holds every query behind a number on this page with the result in a comment, model.py trains and scores the forecast, and charts.py draws the figures.
Sources
- City of Toronto Open Data, Parking Tickets
- City of Toronto, Administrative Penalty System 2024 Activity report
- City of Toronto, parking fines to increase on August 1
- City of Toronto, 2024 Budget Notes, TPS Parking Enforcement Unit
- Global News, parking enforcement suspended, March 2020
- CTV News, rush-hour enforcement resumes, July 2022
- Global News, lot fines $30 to $75, November 2023
- CBC News, out-of-province parkers, 2015